Read the server view in order
Start with the registered server and its active workspace. Check agent connection and the timestamp of its latest sample before interpreting the resource cards. The diagram below is an original illustration of the information groups verified in the current Monitor source; it is not a live server screenshot.
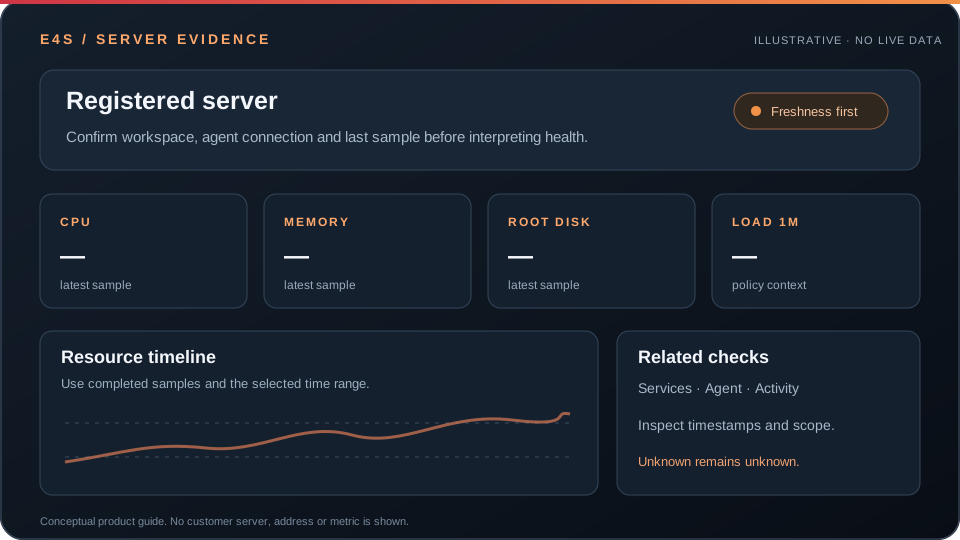 Illustration only. The actual Monitor displays CPU, memory, root disk, one-minute load, a resource timeline, and system facts when those signals are available.
What the cards mean
- CPU: utilization and processor context. Compare the value with the selected period; one point does not establish a sustained bottleneck.
- Memory: current use relative to installed memory. Investigate application workload before changing limits.
- Root disk: capacity pressure on the reported filesystem. Confirm which mount is affected.
- Load: Linux runnable or waiting work over one minute, interpreted against the configured policy and CPU capacity.
Next steps
- Check the last sample and agent capability.
- Compare the resource timeline with the incident window.
- Open related services and recent activity for context.
- Record the finding or escalate through the authorized operational workflow.
A missing sample remains unknown, not healthy. See reading resource signals and service health.
Before taking action
← Back to documentationConfirm the active workspace, required permission, registered asset, and freshness of the data being used.