





On this page
Nginx logs can tell you when a request reached the proxy, which status the proxy returned and whether it reported an upstream error. They cannot, by themselves, prove the root cause inside the application or database. This guide shows a privacy-conscious triage workflow for a Linux Nginx deployment. Paths and service names are examples: discover the active configuration on your host before reading or changing anything.
Prerequisites and incident scope
Record the failing URL, approximate UTC time, client impact and observed response code. Confirm whether the application sits behind a CDN or another reverse proxy. Identify the current Nginx configuration and log destinations; logs may be files, syslog or a centralized collector. Do not assume every vhost writes to /var/log/nginx/access.log. Restrict access to logs because they may contain IP addresses, query strings and user agents.
nginx -T 2>/dev/null | grep -E 'access_log|error_log|server_name'
date -u
nginx -T prints the full effective configuration and may expose sensitive paths or values. Run it only on an authorized host and avoid pasting complete output into a public ticket. The grep filter reduces output but is not a security sanitizer. A local config file may not reflect what is currently loaded if a reload failed; compare with recent service logs and deployment history.
Correlate a narrow time window
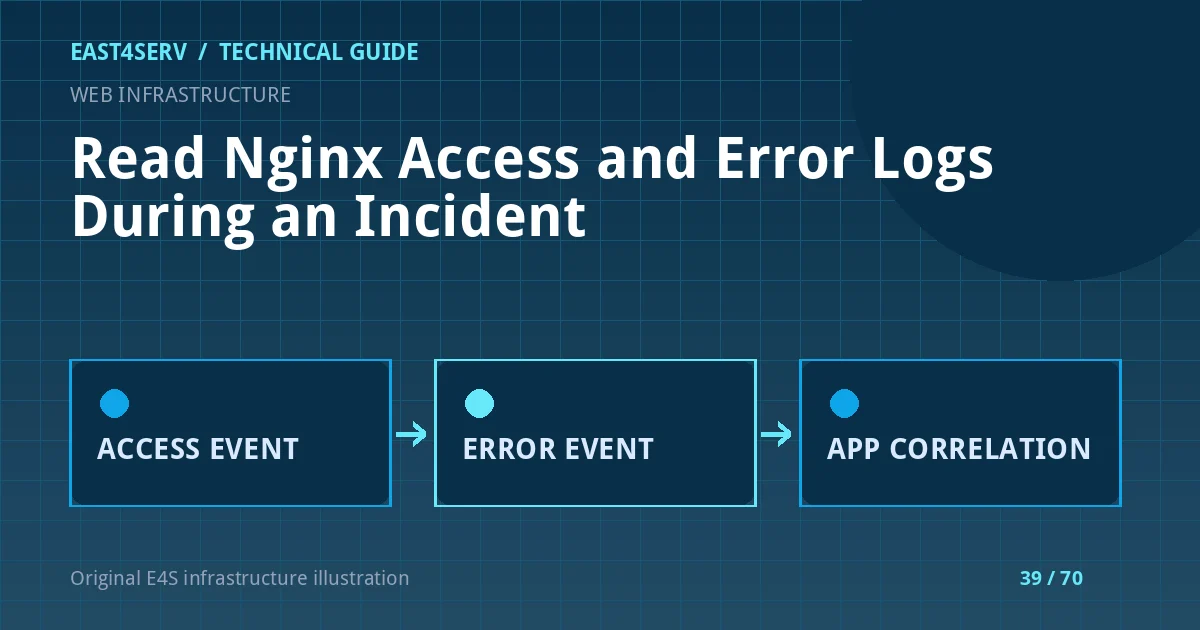
Start with the request's timestamp and path. Search the access log for the relevant route and status, then inspect the error log around the same time. A burst of 502 responses may indicate a backend socket or process problem, while 404 responses may come from either Nginx or the app. A 429 may be generated by Nginx, the application or an upstream edge service. Use response headers and logs to identify the actual layer before changing rate limits.
tail -n 100 /var/log/nginx/access.log
tail -n 100 /var/log/nginx/error.log
These commands are read-only examples. tail may miss the incident if the log rotated or traffic is high. Search the rotated file or central log store with an exact time range. Do not run a broad grep over years of logs on a busy production server. Capture a small redacted sample with request IDs where possible.
Understand what fields mean
The access_log directive selects a destination and format; log_format controls recorded fields. Nginx documents that a request is logged in the location where processing ends, which can differ from the original location after an internal redirect. A configured format may include $status, $request_time, upstream status and upstream response time, but do not assume those fields are present in a default log. Read the local log_format definition before interpreting a column.
Use a request correlation ID to connect Nginx and application logs. Ensure the edge overwrites untrusted incoming IDs or marks them as client-supplied; otherwise an attacker can forge misleading log entries. Avoid logging request bodies or sensitive headers. If a query string contains tokens, design a log format and application route that avoids recording them.
Distinguish proxy and backend failures
For a 502, inspect the error text: connection refused, missing Unix socket, permission denied and timeout call for different checks. Confirm the backend service and socket through read-only status commands. For a 499, remember it often indicates the client closed the connection before the response completed; investigate duration and upstream state rather than assuming the client is malicious. For a sudden rise in 403, compare app authorization logs, WAF events and Nginx rules without disabling protections globally.
systemctl status nginx --no-pager
ss -ltn
These commands do not restart services. If the site uses a Unix backend socket, ss -ltn will not show it; inspect Unix sockets and the configured upstream path. Confirm database and queue health separately because a 200 homepage can coexist with failed customer workflows.
Preserve evidence and verify a fix
Keep a small timestamped record of request ID, route, status, error line, related application exception and change made. Redact personal data. After a targeted fix, check the same route and watch the relevant log window for recurrence. Verify login, checkout, chat or other affected customer flow, not only the homepage. If a deployment was involved, retain the previous configuration and rollback instructions. Log rotation and retention should be bounded so diagnostics do not fill the disk.
FAQ: Can access logs prove a human viewed a page? No; bots, prefetching and proxies can generate requests. FAQ: Is a 502 always a PHP-FPM issue? No; upstream network and application failures also cause it. Expected result: an engineer can identify the failing layer, preserve minimal evidence and verify the customer-facing repair.
Related reading: Nginx 502 and PHP-FPM diagnosis and journald retention. East4Serv server management can assist with incident triage.
Primary references: https://nginx.org/en/docs/http/ngx_http_log_module.html and https://nginx.org/en/docs/ngx_core_module.html.