





On this page
An application killed by the Linux out-of-memory mechanism is an outcome, not a diagnosis. The cause may be a genuine rise in workload demand, a memory leak, an overly small container or systemd limit, swap pressure, or another process competing for the same host. Increasing RAM without evidence may delay the next incident while leaving the failure mechanism intact.
This guide covers Linux hosts and containers using a current kernel. Commands are read-only unless explicitly stated. Cgroup paths and tools vary between distributions and container runtimes; verify whether the host uses cgroup v2 before interpreting its counters. Do not change kernel memory settings on a production server during an incident without a reviewed rollback.
Prerequisites: identify the incident window
Record the affected service, approximate time, host or container identity, and user-visible symptom. A process exit code 137 often indicates a SIGKILL, but that signal can come from other causes; it is not proof of a kernel OOM decision. Collect application logs and host journal entries before restarting the process repeatedly.
uptime
free -h
cat /proc/pressure/memory
sudo journalctl -k -b --no-pager | grep -Ei 'out of memory|oom-kill|killed process'
free is a current snapshot; it cannot show yesterday's peak. Linux uses available RAM for cache, so “free” near zero by itself is not an incident. Memory pressure data shows stalled work over time but needs a baseline to interpret. If persistent journals are unavailable, say so and use monitoring history or provider evidence instead of inventing a prior state.
Step 1: Determine the OOM scope
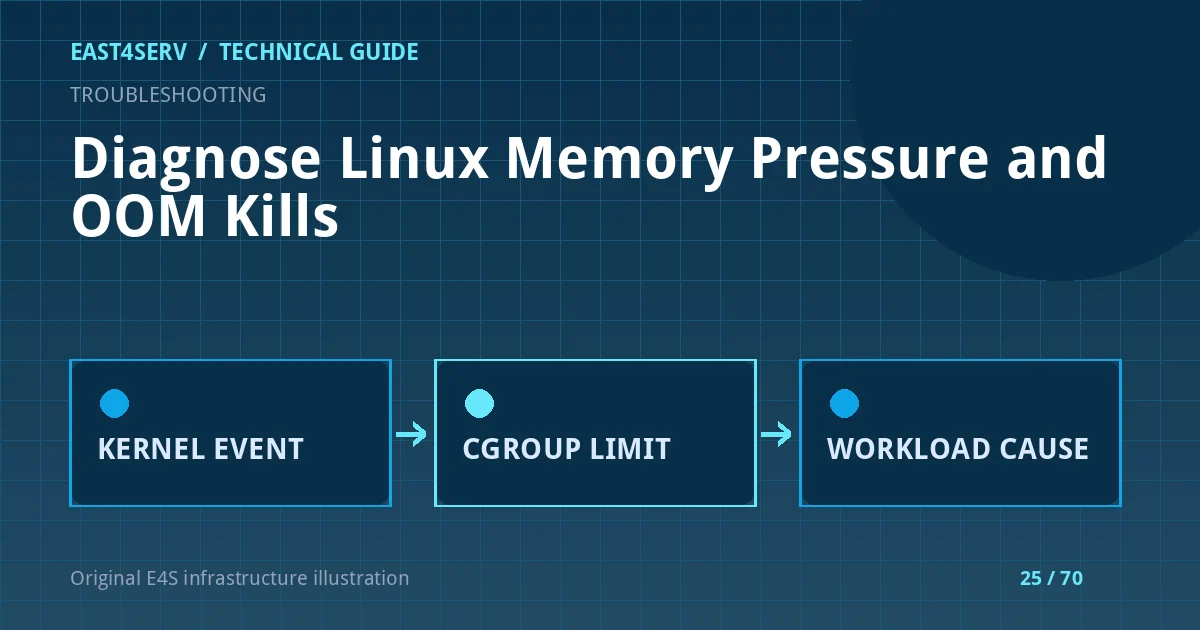
Read the kernel message around the event. Was it a system-wide OOM, a memory-cgroup limit, or an application manager kill? A cgroup can hit its memory.max even when the host still has free RAM. The Linux kernel's cgroup v2 memory.events file reports counters such as high, max, oom, and oom_kill; locate the relevant service or container cgroup before reading it.
systemctl status example.service --no-pager
systemctl show example.service -p ControlGroup -p MemoryMax -p MemoryCurrent -p OOMPolicy
cat /sys/fs/cgroup/cgroup.controllers
Replace example.service with the actual unit. The ControlGroup value identifies its cgroup path. If the host uses cgroup v2 and the path is accessible, inspect that group's memory.current, memory.max, and memory.events. Do not assume a counter increase belongs to the most recent event without a prior sample.
Step 2: Inspect processes and workload behavior
When the system is stable enough to observe, compare resident memory, process count, and workload rates. A sudden increase in workers or request concurrency can multiply per-process memory. A cache may grow by design but still needs a bounded budget. A database may reserve large memory intentionally and compete with PHP or application workers on a small host.
ps -eo pid,ppid,comm,rss,%mem --sort=-rss | head -25
systemctl status example.service --no-pager
sudo journalctl -u example.service -b --no-pager -n 120
RSS is only one view of process memory and may double-count shared pages across processes. For containers, also inspect the runtime's reported limit and memory metrics. Correlate the event with deployments, traffic changes, queue backlog, and scheduled jobs. The strongest diagnosis explains both the memory growth and why reclaim or the configured limit could not accommodate it.
Step 3: Choose a bounded correction
If a deployment introduced an unbounded worker count, revert or reduce concurrency under change control. If a cgroup limit is too low for a measured legitimate peak, adjust it with headroom after reviewing host capacity. If the application leaks memory, patch or recycle the offending process while investigating the root cause. If swap is absent or exhausted, evaluate a swap policy against latency and disk endurance; swap is not a substitute for sufficient RAM.
Do not clear caches or drop kernel page cache repeatedly as a “fix.” That can worsen I/O and obscure the real workload. Likewise, setting oom_score_adj=-1000 broadly can protect one process by sacrificing another critical service. Treat kernel and service-limit changes as production changes with rollback and monitoring.
Expected result and verification
After the change, the affected workload stays within measured memory headroom, cgroup OOM counters stop increasing during normal peaks, memory pressure returns toward baseline, and application health is confirmed. Verify this over a representative traffic window, not just five minutes after restart. Keep an alert for memory pressure and OOM events with an owner who can respond.
Troubleshooting and common errors
- No OOM line in current boot: the event may have occurred before reboot, or journals may be volatile. Consult persistent logs and monitoring history if available.
- Host has free RAM but container dies: inspect its own cgroup limit and events rather than only
free -hon the host. - Memory rises only after deploy: compare worker counts, code paths, and background jobs introduced by the release.
- One process looks large: distinguish expected mapped/cache memory from private growth; correlate with request volume and application metrics.
- Repeated restart loop: stop blind retries and capture the first failure and limits. A restart policy cannot create memory headroom.
Security and operational considerations
OOM events can be triggered by abusive traffic, but a spike alone is not proof of an attack. Preserve request metadata without logging private payloads. Protect journal and metrics access because process names and command lines may disclose operational details. Changes to limits should not make a database or monitoring process vulnerable to a different resource-exhaustion failure.
FAQ
Does exit code 137 always mean OOM?
No. It indicates termination by SIGKILL in many shell/runtime conventions; inspect kernel and cgroup evidence to identify who sent the signal and why.
Does low “free” memory mean I must add RAM?
No. Linux uses RAM for reclaimable caches. Consider available, pressure signals, swap activity, and application latency together.
Can I rely on memory.events alone?
No. It gives counters for a cgroup; use event timing, service logs, workload metrics, and the configured limit to reconstruct the incident.
Continue reading
See Linux high CPU investigation, Linux health monitoring, and Laravel worker operations. If a customer host needs sustained operational review, discuss a scoped server management engagement.
References: Linux memory-management concepts, cgroup v2 memory controller, and systemd resource control. Commands are illustrative and should be checked against the target host.