





On this page
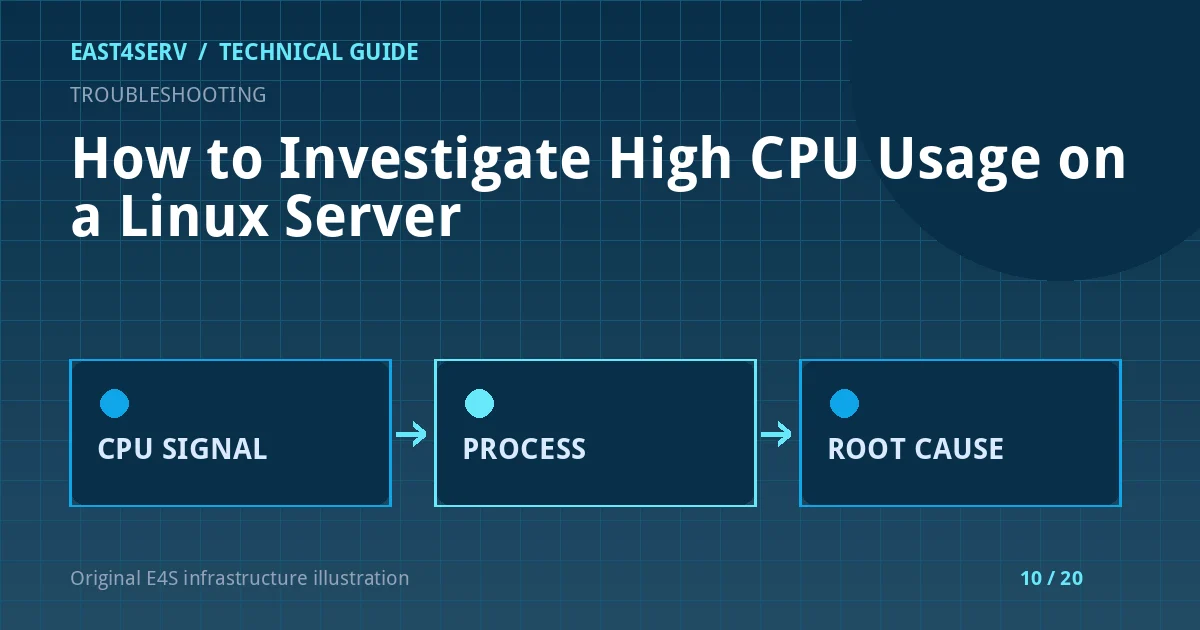
High CPU is a symptom, not a diagnosis. A brief peak during a scheduled build or backup may be expected. Sustained saturation with rising request latency, failed health checks, or queue growth needs investigation. The goal is to identify which process consumes CPU, why it does so, and whether the host has enough capacity for the workload.
These commands are read-only examples for recent Ubuntu, Debian, and RHEL-family systems. Run them as an authorized operator. Do not kill or restart a process merely because it is at the top of a list; it may be a database checkpoint, a recovery operation, or a critical customer request.
1. Establish whether the pressure is current or historical
Use uptime for recent load averages and top or ps for current process use. Compare these with monitoring history and the time when customers noticed the problem. Load average is not identical to CPU percentage; on Linux it can include tasks waiting for uninterruptible I/O.
uptime
top -b -n 1 | head -35
ps -eo pid,ppid,user,stat,%cpu,%mem,etime,comm --sort=-%cpu | head -25
A process briefly showing 100% CPU may be using one core on a multi-core host. Look at total CPU, per-core pressure, wait time, and whether the process is single-threaded. ps is a snapshot; repeated samples are more useful than a single moment.
2. Map the process to its service and recent change
Identify the parent process, systemd unit, and deployment history. Is this a PHP-FPM worker, database server, container, compiler, backup, or an unexpected binary? Use command-line inspection carefully; process arguments can contain secrets.
ps -fp 12345
systemctl status 12345 --no-pager
journalctl --since '30 minutes ago' -p warning --no-pager
Replace 12345 with a real PID. Review the change timeline: application release, traffic increase, cron/timer start, cache invalidation, failed retry loop, database migration, or crawler. A CPU spike that begins exactly at a recurring timer is different from a new external traffic surge.
3. Check memory and I/O before “adding CPUs”
CPU may be busy because the application is compensating for memory pressure or repeatedly retrying a slow disk operation. Look at memory availability, swap activity, disk errors, and process states.
free -h
vmstat 1 5
df -h
sudo journalctl -k --since '1 hour ago' --no-pager | tail -80
vmstat shows run queue and I/O wait trends; interpret it in the context of core count and workload. If the kernel reports out-of-memory kills, increasing worker concurrency can worsen the problem. If storage is failing or full, address that condition before tuning application threads.
4. Correlate with application and database evidence
For a web app, compare request rate, response time, error rate, and worker count. Look for a route or background job that became slow. For a database, inspect slow-query evidence and index usage with database-specific tools; do not enable expensive tracing on a busy production system without planning.
A cache miss storm can shift work from Redis to the database. A retry loop can burn CPU while doing little useful work. Queue depth and oldest-job age tell you whether workers are keeping up. Check whether monitoring itself has gone stale before concluding the issue ended.
5. Mitigate in a controlled way
Possible actions include reducing a runaway batch job's concurrency, fixing a query, restoring cache behavior, adding capacity, or temporarily rate-limiting abusive traffic. Choose based on evidence. Record what changed, the observed before/after metrics, and a rollback. If an application process is compromised, preserve evidence and follow the incident plan rather than only killing it.
Troubleshooting and common errors
- Load high but CPU mostly idle: investigate disk I/O and processes in uninterruptible sleep.
- One core saturated, others idle: look for a single-threaded bottleneck or lock contention.
- CPU normal but latency high: inspect external dependencies, database locks, queue delays, and network.
- Many short-lived processes: review cron/timers, web request fan-out, and worker crash loops.
- Spike repeats daily: correlate with backups, reports, indexing, or scheduled tasks.
Security considerations
Unexpected CPU use may indicate unauthorized cryptocurrency mining or compromised software, but do not assume that without evidence. Restrict diagnostic data because process names and arguments can reveal secrets. Preserve logs and timestamps if suspicious activity is found. Avoid exposing top or ps output publicly.
FAQ
Does 100% CPU always mean the server is overloaded?
No. It may mean one core is fully used for a moment. Customer impact depends on duration, available cores, queueing, and response time.
Should I immediately add more vCPUs?
Only after identifying whether the bottleneck scales with CPU. A slow query, lock, or external dependency may remain slow on a larger host.
Can a full disk cause high load?
Yes, blocked I/O and repeated write failures can contribute to load or application retries. Check disk bytes, inodes, and kernel errors.
Continue reading
Use Linux disk-space diagnosis when storage is involved, and server health monitoring to build a baseline. Ask East4Serv for a scoped production performance assessment.
Reference: Red Hat monitoring and managing system status and performance.