





On this page
Monitoring a Linux server means combining current resource measurements with a history of checks and the service's actual customer experience. A single green status is not enough: the agent may be stale, the website check may follow an unexpected redirect, or the server may be healthy while a database dependency is unavailable.
The commands below are read-only examples for recent Ubuntu and Debian servers. Other distributions may package tools differently. Use only on assets you are authorized to inspect; avoid sending sensitive hostnames, URLs, or log contents to an unapproved external monitoring service.
1. Start with the service boundary
List the critical customer journeys: homepage, login, checkout, API, database-backed action, and any background job. Decide which signals show whether each journey is healthy. A host can have low CPU and still return errors. Conversely, high CPU for a short, expected batch job may not require an incident.
For each check, record its target, interval, timeout, owner, and escalation path. Make sure monitoring detects the absence of data. “No recent metric” must not be displayed as a healthy zero.
2. Inspect CPU, memory, disk and load together
These quick commands provide a starting point, not a diagnosis. Compare them with the server's normal range and with application logs.
uptime
free -h
df -h
df -i
sudo ss -s
uptime reports load averages, which include tasks waiting for CPU and, on Linux, uninterruptible waits such as I/O. free includes reclaimable cache; do not treat all used memory as a leak. df -i helps detect inode exhaustion when bytes remain available. Alert thresholds should be based on trend and remaining time to exhaustion rather than one arbitrary percentage.
3. Observe network behavior with context
Network monitoring should distinguish incoming and outgoing traffic, packet errors, interface saturation, and expected traffic peaks. An absolute byte counter can wrap or reset after reboot; compute rates with timestamped samples and handle resets. Check the interface actually carrying application traffic.
ip -s link
ss -tuna
Interface counters alone do not say which application caused the traffic. Correlate them with reverse-proxy access logs, firewall events, and approved flow telemetry. Protect client IP data under your privacy policy.
4. Monitor agents and external checks separately
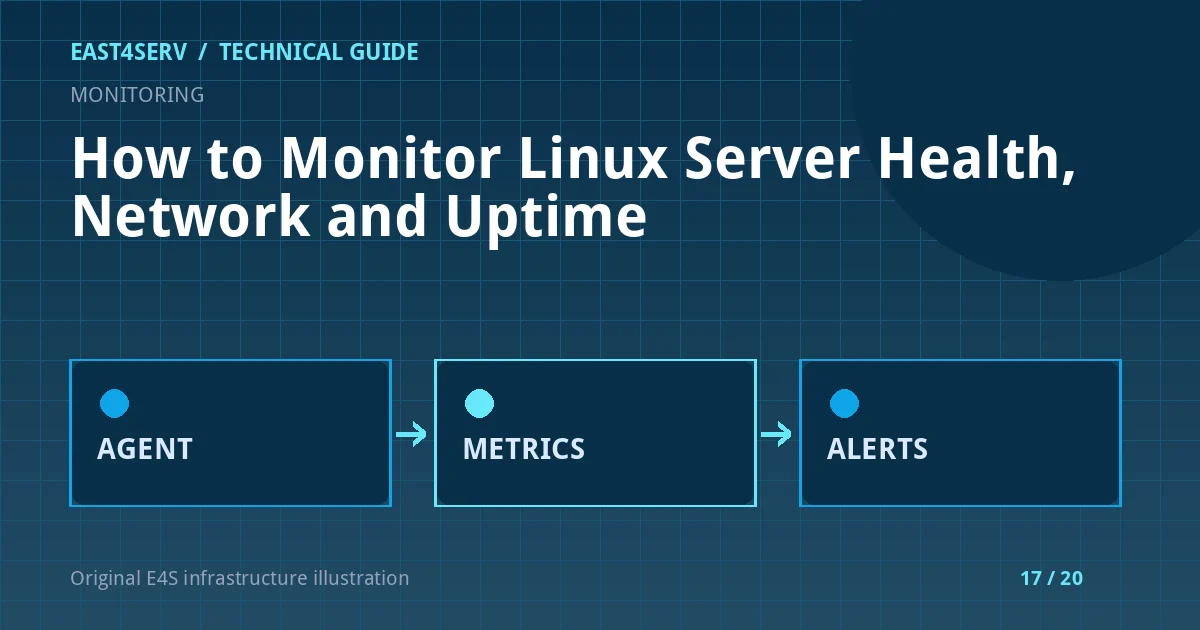
An installed agent can report CPU, memory, disk, process, and service state from inside the host. External HTTP/TCP checks can detect whether a public endpoint is reachable from outside. Use both where appropriate: an agent that has gone silent is a coverage failure, while a public check can catch DNS, TLS, routing, or CDN issues even when the host remains healthy.
For each agent, show last seen, version, enrollment state, and the workspace/client assignment. A server must be explicitly mapped to the correct customer before its metrics appear in that customer's portal. Never assign assets based only on a similar hostname.
5. Design alerts that lead to action
An alert needs a clear condition, sustained duration or repeat count, route, owner, and runbook. Group related symptoms without suppressing evidence. For example, a host outage might trigger CPU-missing, HTTP-failed, and agent-offline signals; the incident view can tie them together while preserving raw events.
Test alert delivery. A working mail server does not prove a queued notification reached the recipient. Watch notification backlog and failures, and use an alternate channel for critical incidents when available. Define a recovery condition so an alert does not remain open forever after the host returns.
Troubleshooting and common errors
- Server shows zero CPU while agent is offline: present “no data” or stale status, not a healthy zero.
- Website check is green but checkout fails: add a representative synthetic or application-level check, mindful of test accounts and payment side effects.
- Network chart spikes after reboot: identify counter resets and sample gaps before treating the value as real traffic.
- Alerts are noisy: adjust duration, grouping, and thresholds using historical data rather than disabling the entire check.
- Only one region checks the site: consider an independent second vantage point if geographic reachability matters.
Security considerations
Use short-lived, scoped agent enrollment credentials. Store metric data per tenant and enforce authorization at query time. Mask secrets in logs and never expose another customer's host through a shared chart or cache key. Operational access, such as service restart or terminal, needs separate entitlement and audit from read-only monitoring.
FAQ
What is the difference between uptime and availability?
Host uptime is time since boot; application availability is whether a service is reachable and usable. One does not guarantee the other.
How often should I sample metrics?
Choose intervals based on the incident you need to detect, retention cost, and agent/network capacity. A one-minute interval can miss shorter spikes, while very frequent samples create storage and alerting load.
Is a single CPU chart enough for capacity planning?
No. Include memory pressure, I/O, disk growth, network, latency, error rates, and business traffic patterns.
Continue reading
For an incident workflow, see investigating high CPU usage and Linux disk exhaustion. Explore E4S monitoring or contact East4Serv for a scoped monitoring design.
References: Prometheus alerting practices and Linux cgroup v2 documentation.