Resource state with collection context
For registered Linux servers, E4S presents the resource signals available from the deployed agent: CPU, memory, disk, load, network, and related service state. Agent freshness and monitoring history help distinguish a live resource problem from a stale sample.
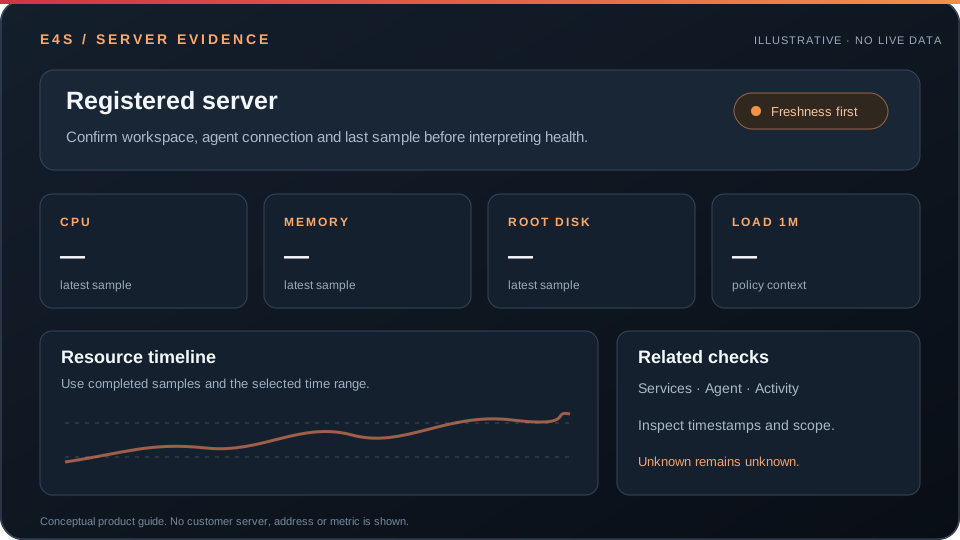
Illustrative panel layout; values are not live monitoring data.
How operators investigate
- Confirm server identity and active workspace.
- Check agent connection time and supported capabilities.
- Compare resource trends with service failures and recent changes.
- Review alert and report history before drawing a conclusion.
High load does not always mean high CPU. Disk capacity and disk latency are different conditions. Read the server evidence guide for the detailed interpretation sequence.
Onboard a server with the right boundary
Confirm the server is owned or administered by your workspace, its hostname and the operating system before enrolling an agent. The first heartbeat establishes that collection is working; it does not prove the full application stack is healthy. Configure the metrics and alert recipients supported by that agent and plan.
Read the measurements together
CPU usage, load, RAM, disk and network traffic describe different forms of pressure. Review the last-seen time and a relevant historical window before drawing a conclusion. If the agent is offline, treat live resource values as unavailable and investigate collection separately. For a web application, compare the host view with website checks and service health.
Can free monitoring restart a server? No. Remote controls require a separate eligible operational entitlement and explicit authorization. Follow the server monitoring guide or ask about managed response.